← all workSYSTEMS · DATA ENGINEERING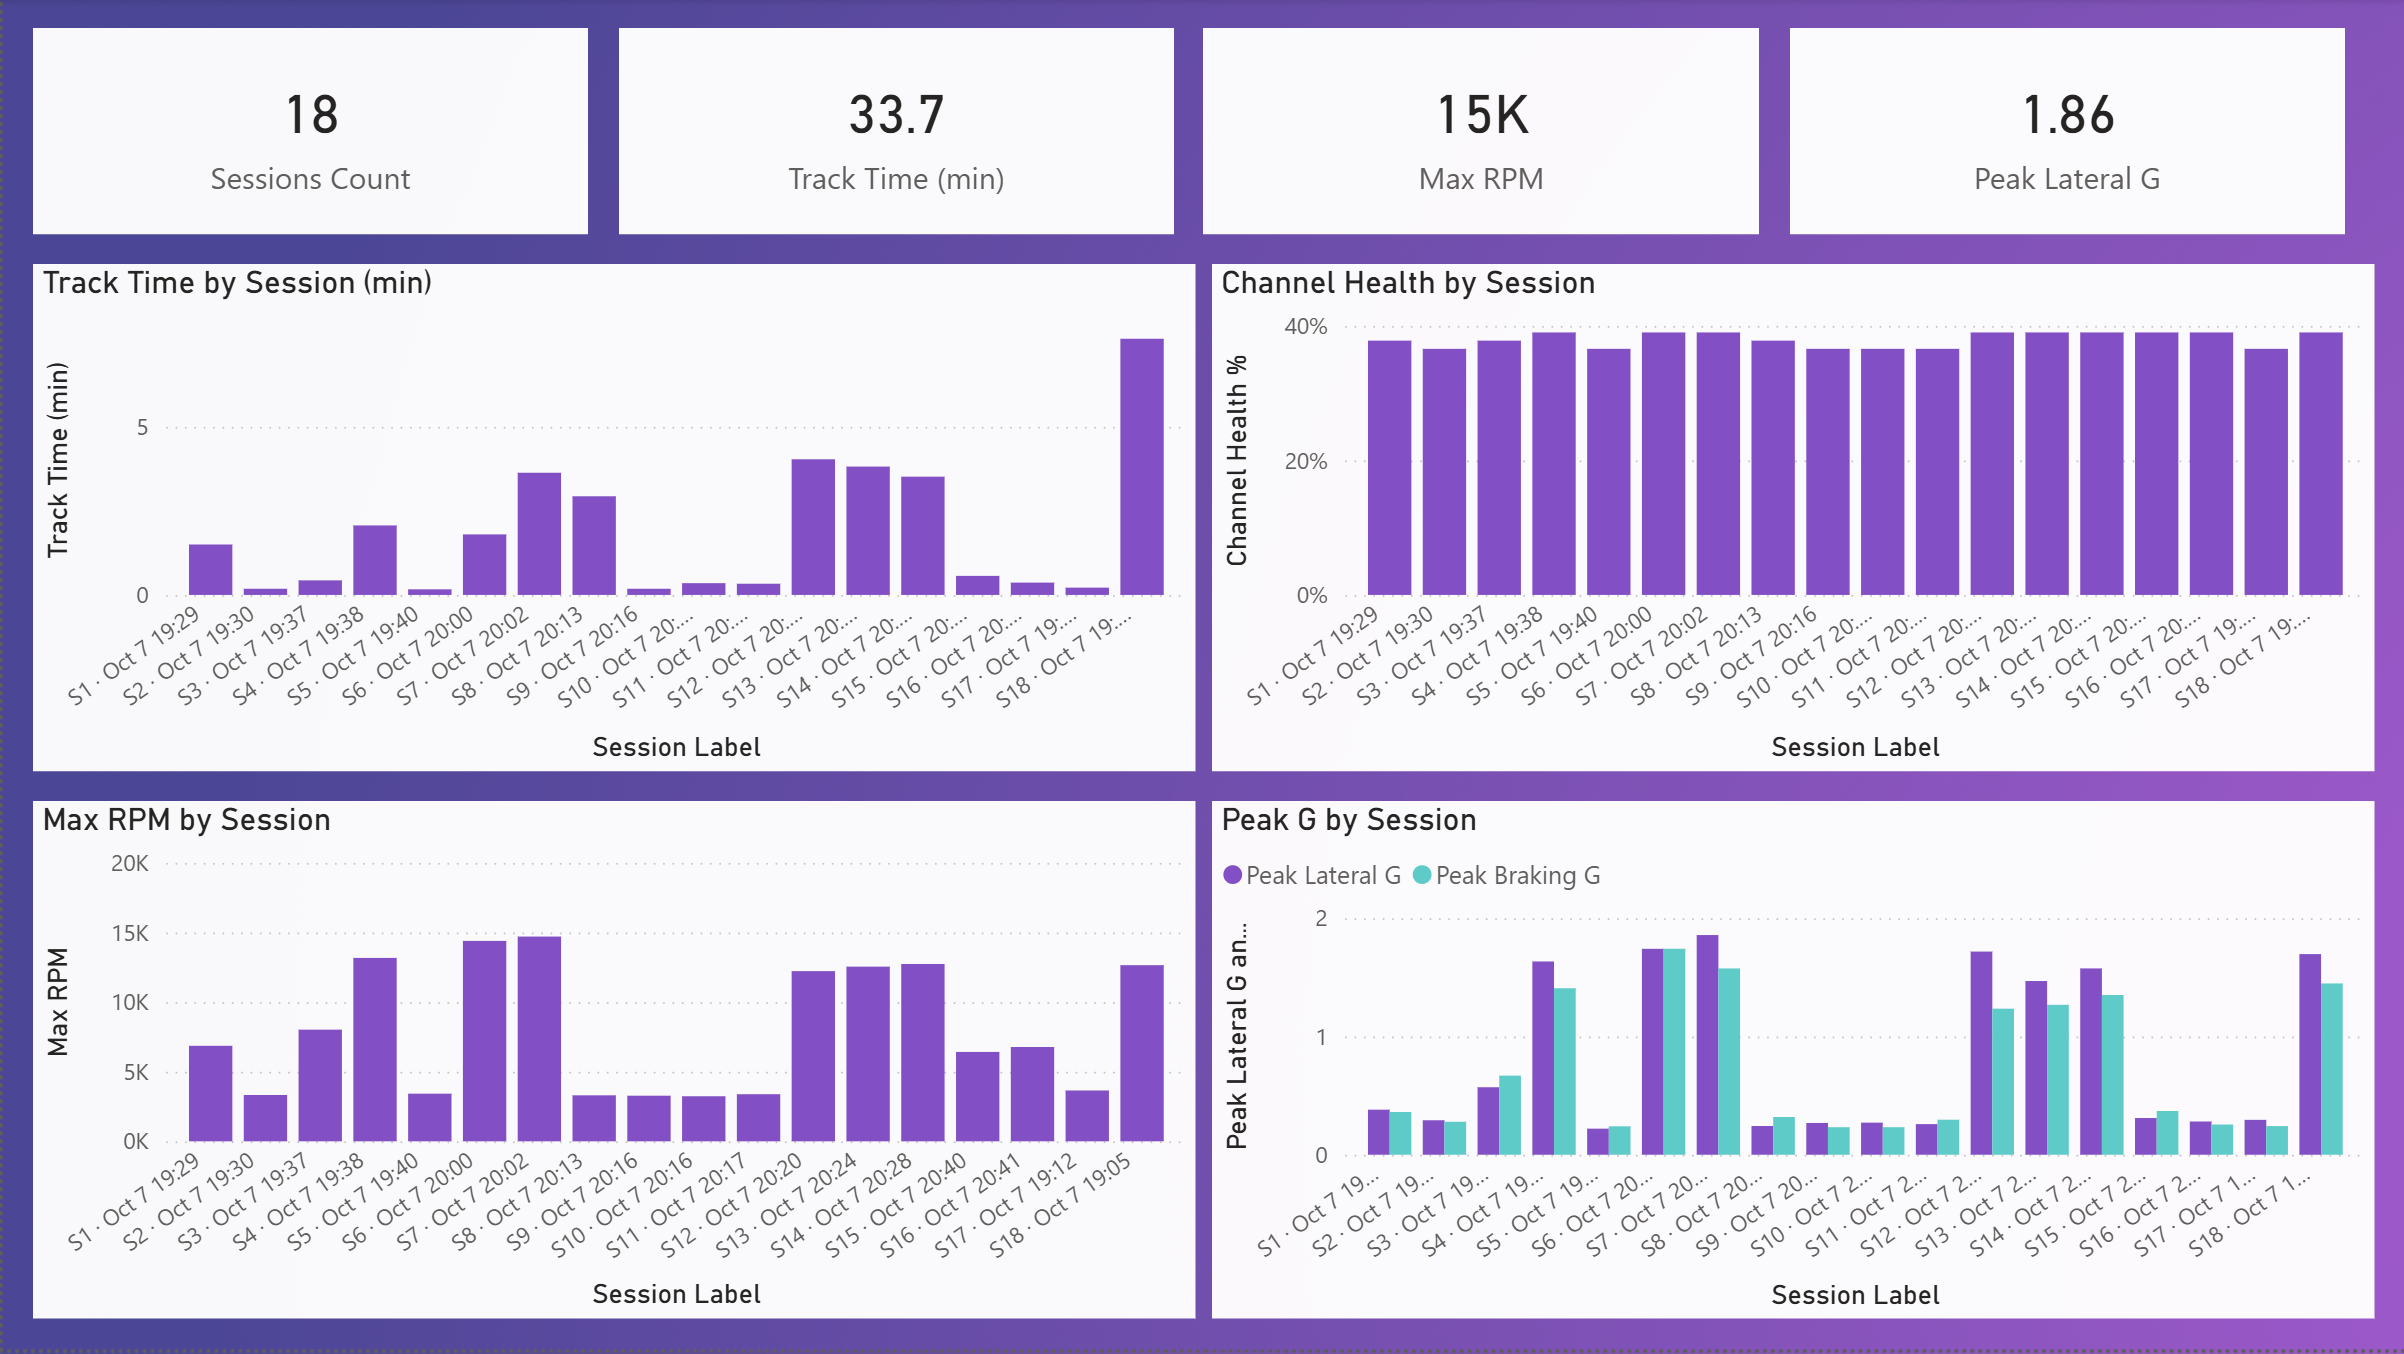
 →
→
Race Telemetry
One night at UTA autocross, 18 sessions of raw CAN logs. I built the whole path: content-hash idempotent ingest with per-file error isolation, a 1 Hz continuous aggregate on a TimescaleDB hypertable, a star schema, typed FastAPI serving, and CI that runs against a real database.
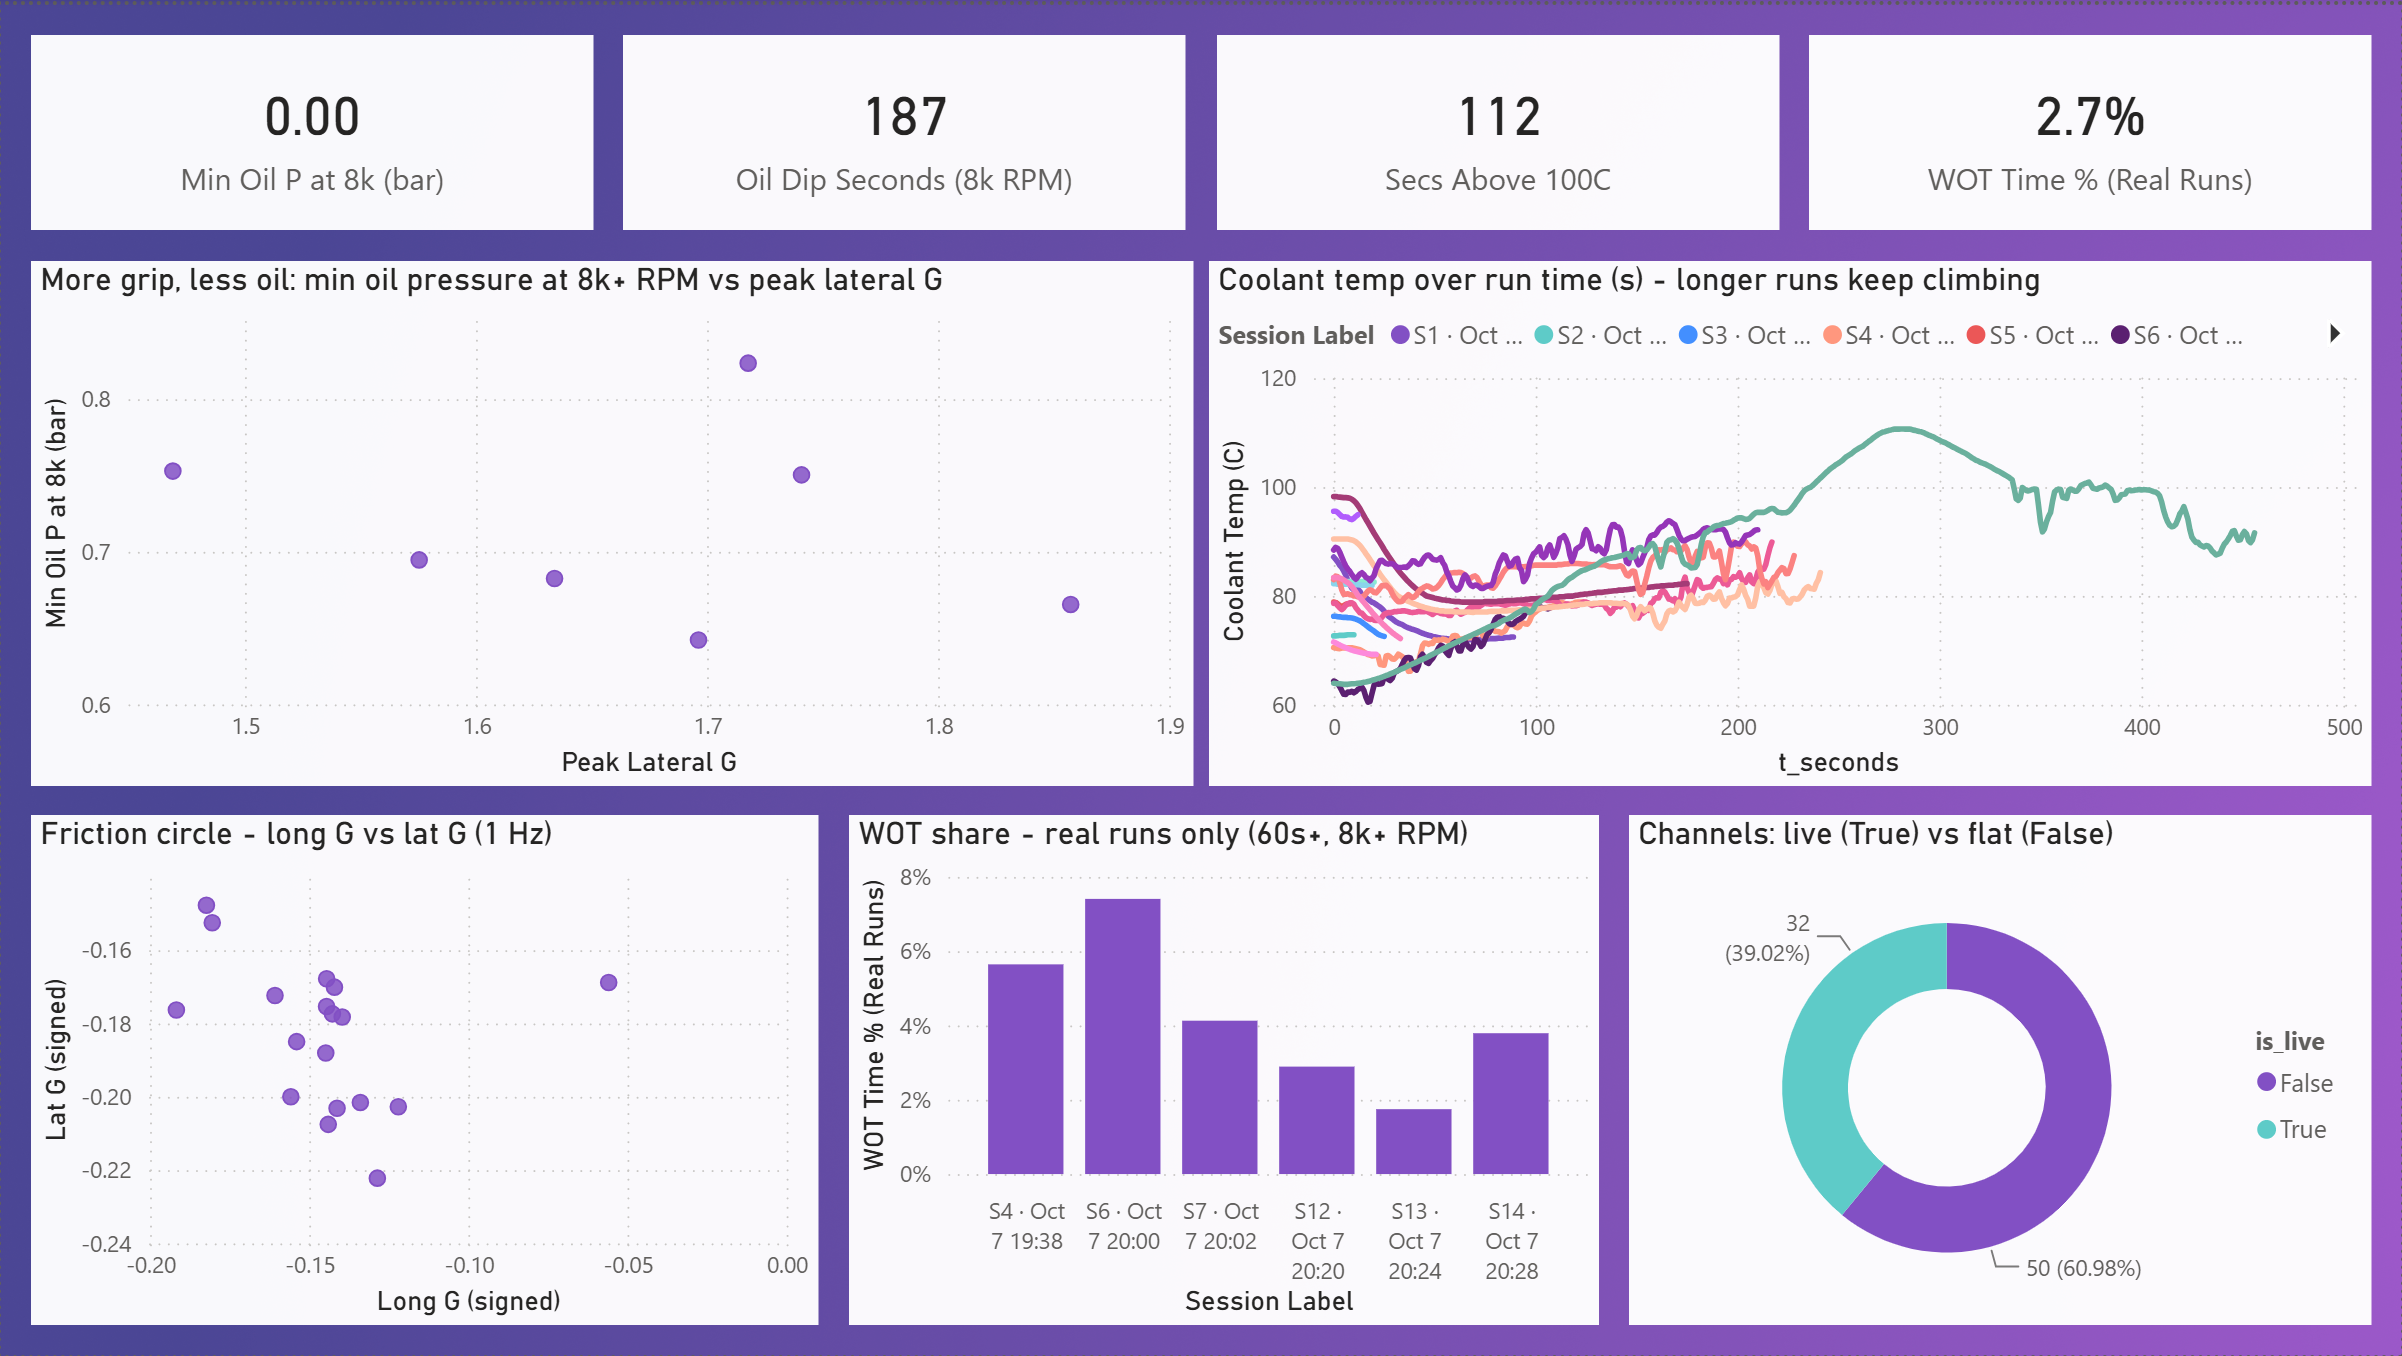
⌐ what the aggregate caught — oil starvation
At 8k+ RPM under peak lateral G, minimum oil pressure fell to 0.00 bar — 187 s of oil dip across the night, and coolant kept climbing past 100 °C (112 s over the line). The 1 Hz aggregate made the starvation obvious session-over-session — before it turned into engine damage.
18 sessions
raw CAN logs, one night
1 queryable layer
decision-ready, CI-guarded